Here is a simple way to use Microsoft Excel for data analysis
Microsoft Excel is a powerful tool that can help you perform various types of data analysis, such as descriptive statistics, data visualization, data cleaning, data transformation, and data modeling. In this short blog post, we will show you some basic steps and tips on how to use Excel for data analysis.
Step 1: Import your data into Excel
The first step is to import your data into Excel. You can do this by opening Excel and clicking on the File tab, then selecting Open. Browse to the location of your data file and click on it. Excel will try to detect the format of your data and display a preview of it. You can adjust some settings, such as the delimiter, the header row, and the data type of each column, before clicking on Load.
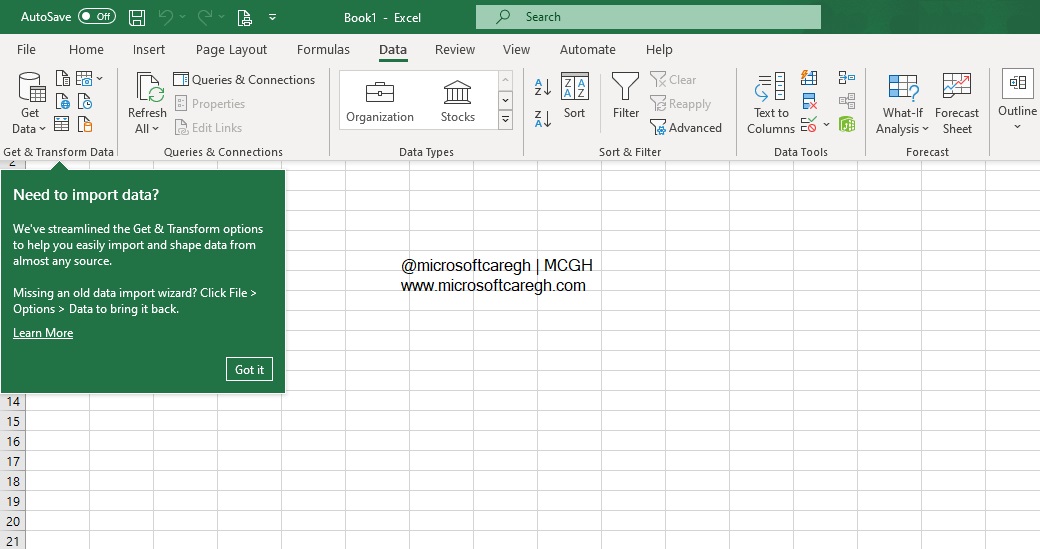
Alternatively, you can also import your data from other sources, such as a web page, a text file, a database, or another workbook. To do this, click on the Data tab, then select Get Data. Choose the source of your data and follow the instructions on the screen.
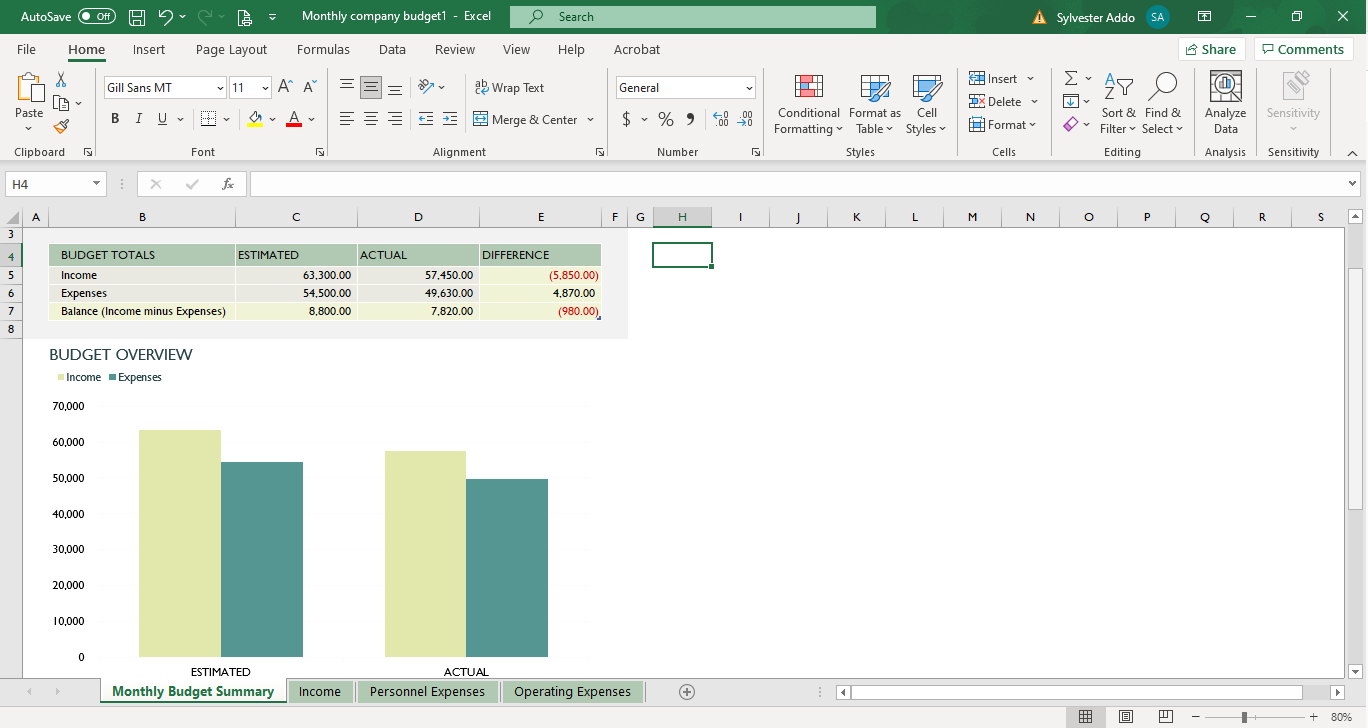
Step 2: Explore your data in Excel
The next step is to explore your data in Excel. You can do this by using various features and tools that Excel provides, such as:
- The Quick Analysis tool: This tool allows you to quickly apply some common analysis tasks to your selected data range, such as formatting, charts, tables, sparklines, and formulas. To use this tool, select your data range and click on the Quick Analysis icon that appears at the bottom right corner of your selection. Then choose the category and option that you want to apply.
- The Filter and Sort options: These options allow you to filter and sort your data based on certain criteria or values. To use these options, select your data range and click on the Filter icon or the Sort icon on the Home tab. Then choose the column and condition that you want to filter or sort by.
- The PivotTable and PivotChart tools: These tools allow you to summarize and visualize your data in a dynamic and interactive way. To use these tools, select your data range and click on the PivotTable or PivotChart icon on the Insert tab. Then drag and drop the fields that you want to analyze into the appropriate areas of the PivotTable or PivotChart.
Step 3: Analyze your data in Excel
The final step is to analyze your data in Excel. You can do this by using various functions and formulas that Excel provides, such as:
- The Statistical functions: These functions allow you to perform various statistical calculations on your data, such as mean, median, mode, standard deviation, correlation, regression, and hypothesis testing. To use these functions, enter them in a cell with the appropriate arguments and press Enter.
- The Data Analysis ToolPak: This is an add-in that allows you to perform more advanced data analysis techniques on your data, such as ANOVA, t-test, chi-square test, Fourier analysis, histogram, and random number generation. To use this add-in, you need to enable it first by clicking on the File tab, then selecting Options. Click on Add-Ins on the left pane, then select Excel Add-Ins from the Manage drop-down list at the bottom. Click on Go and check the box next to Analysis ToolPak. Click on OK and restart Excel.
Once you have enabled the add-in, you can access it by clicking on the Data tab, then selecting Data Analysis. Choose the analysis technique that you want to perform and fill in the required parameters.
In this blog post, we have shown you some basic steps and tips on how to use Microsoft Excel for data analysis. We hope that this post has helped you learn more about Excel’s capabilities and features for data analysis. If you have any questions or feedback, please feel free to leave a comment below.
Check out what’s new on our YouTube channel. Subscribe to follow for the latest videos and news in the ecosystem.
Check out other Microsoft stories making the news across Africa and the Middle East region.
- YouTube wouldn’t build an app for the Apple Vision Pro, so Someone did! Introducing Juno
- What is Microsoft 365?
- Get to know Norton Genie app?
- Microsoft Copilot on iOS and Android get upgrade
- Microsoft’s new OneDrive design is out now!
- Sudo command comes to Windows 11
- Google has announced that its first cloud region in Africa is now open for business.
- Apple Vision Pro Review
- Apple’s first-party Podcasts app
- What is Amazon presents Diffuse to Choose?