Microsoft Excel is a powerful tool that can help you perform various types of data analysis, such as descriptive statistics, data visualization, data cleaning, data transformation, and data modeling. In this short blog post, we will show you some basic steps and tips on how to use Excel for data analysis.
Step 1: Import your data into Excel
The first step is to import your data into Excel. You can do this by opening Excel and clicking on the File tab, then selecting Open. Browse to the location of your data file and click on it. Excel will try to detect the format of your data and display a preview of it. You can adjust some settings, such as the delimiter, the header row, and the data type of each column, before clicking on Load.
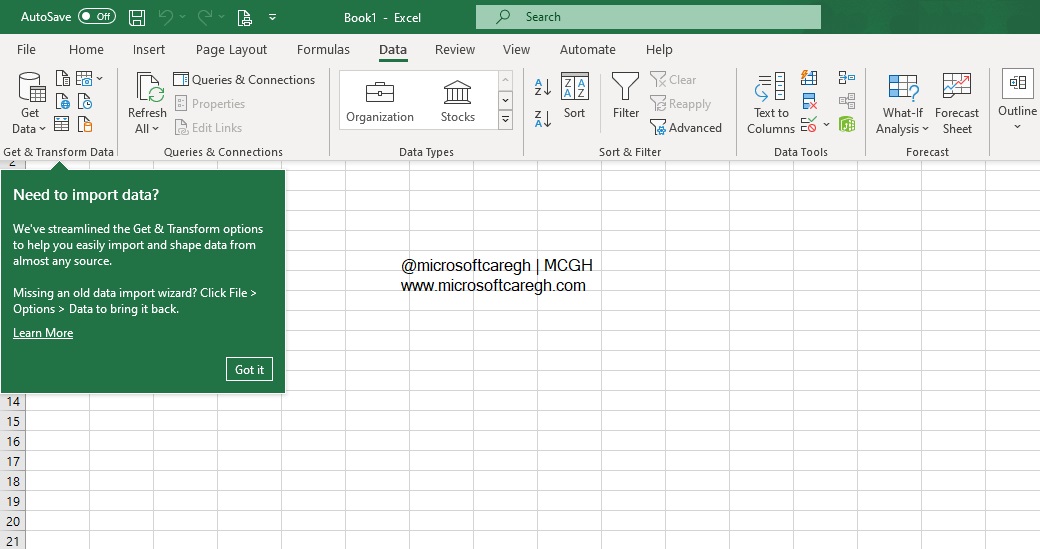
Alternatively, you can also import your data from other sources, such as a web page, a text file, a database, or another workbook. To do this, click on the Data tab, then select Get Data. Choose the source of your data and follow the instructions on the screen.
Step 2: Explore your data in Excel
The next step is to explore your data in Excel. You can do this by using various features and tools that Excel provides, such as:
The Quick Analysis tool: This tool allows you to quickly apply some common analysis tasks to your selected data range, such as formatting, charts, tables, sparklines, and formulas. To use this tool, select your data range and click on the Quick Analysis icon that appears at the bottom right corner of your selection. Then choose the category and option that you want to apply.
The Filter and Sort options: These options allow you to filter and sort your data based on certain criteria or values. To use these options, select your data range and click on the Filter icon or the Sort icon on the Home tab. Then choose the column and condition that you want to filter or sort by.
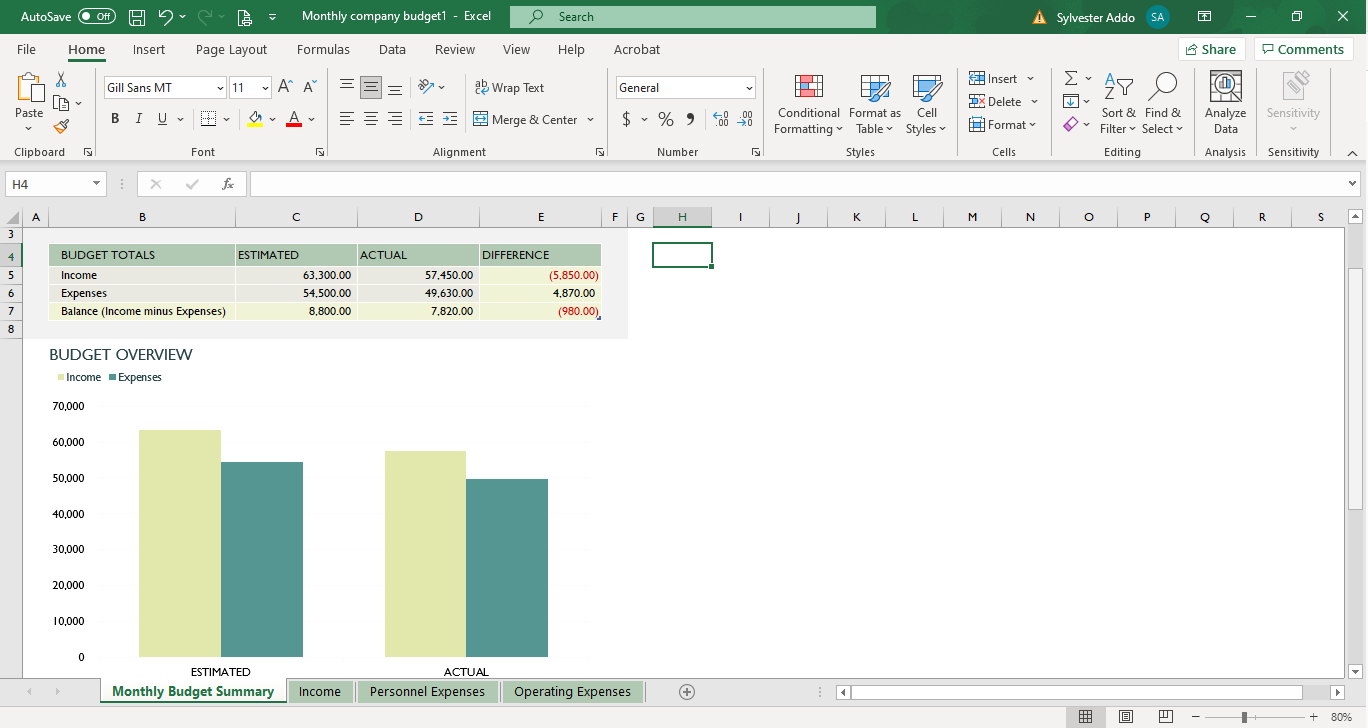
The PivotTable and PivotChart tools: These tools allow you to summarize and visualize your data in a dynamic and interactive way. To use these tools, select your data range and click on the PivotTable or PivotChart icon on the Insert tab. Then drag and drop the fields that you want to analyze into the appropriate areas of the PivotTable or PivotChart.
Step 3: Analyze your data in Excel
The final step is to analyze your data in Excel. You can do this by using various functions and formulas that Excel provides, such as:
The Statistical functions: These functions allow you to perform various statistical calculations on your data, such as mean, median, mode, standard deviation, correlation, regression, and hypothesis testing. To use these functions, enter them in a cell with the appropriate arguments and press Enter.
The Data Analysis ToolPak: This is an add-in that allows you to perform more advanced data analysis techniques on your data, such as ANOVA, t-test, chi-square test, Fourier analysis, histogram, and random number generation. To use this add-in, you need to enable it first by clicking on the File tab, then selecting Options. Click on Add-Ins on the left pane, then select Excel Add-Ins from the Manage drop-down list at the bottom. Click on Go and check the box next to Analysis ToolPak. Click on OK and restart Excel.
Once you have enabled the add-in, you can access it by clicking on the Data tab, then selecting Data Analysis. Choose the analysis technique that you want to perform and fill in the required parameters.
In this blog post, we have shown you some basic steps and tips on how to use Microsoft Excel for data analysis. We hope that this post has helped you learn more about Excel’s capabilities and features for data analysis. If you have any questions or feedback, please feel free to leave a comment below.
Certiport is announcing the winners of the 2021 Microsoft Office Specialist (MOS) World Online Championship. The 19th edition of the competition took place virtually from November 9-11, due to the pandemic. It however attracted more than 200,000 contestants from 108 countries. Six people emerged first place winners with a $7,000 cash prize across six categories. Second and third place winners also won $3,500 and $1,500 cash prizes respectively.
The competition is open to students from the ages of 13 to 22 across the globe. They compete with peers to prove their superior skills in Microsoft Word, Excel, and PowerPoint. This year, regional competitions were held worldwide and 160 finalists from 33 countries qualified to compete in the final round of the competition.
Four students from Africa emerged top ten winners this year. Paras Girish Khetiya from Kenya came tenth place in the Microsoft Word (Microsoft 365 Apps and Office 2019) category. Mahmoud Elkhoshet, Egypt, sixth place in the Microsoft Word (Office 2016) category. Ankain Lesly Chuo, Cameroon, tenth place in the Microsoft PowerPoint (Microsoft 365 Apps and Office 2019) category. Vanessa Obiedo, Nigeria, tenth place in the Microsoft Excel (Office 2016) category.
Next year, Certiport will host the 2022 Microsoft Office Specialist World Championship at Disney’s Grand Californian Hotel in Anaheim, CA, from July 24-27, 2022. To learn more about the event, search the event hashtag #MOSWC on Facebook and Twitter.
The 2021 Microsoft Office Specialist World Champions are:
Microsoft Word® (Microsoft 365 Apps and Office 2019)
First place: Ondrej Cach, Czech Republic
Second place: Man Weng Tong, Macau
Third place: Qiao Yan Yang – Malaysia
Microsoft Word® (Office 2016)
First place: Huy Nguyen Quoc, Vietnam
Second place: Leyao Huang, China
Third place: Peng Yu Lin, Taiwan
Microsoft PowerPoint® (Microsoft 365 Apps and Office 2019)
First place: Andrew Chuang Saladin, USA
Second place: Ma. Jessa Gomez, Philippines
Third place: Ka Hin Hung, Hong Kong
Microsoft PowerPoint® (Office 2016)
First place: Masaharu Komiyama, Japan
Second place: Carson Mulvey, USA
Third place: Siddh Vora, India
Microsoft Excel® (Microsoft 365 Apps and Office 2019)
First place: Ami Nakazono, Japan
Second place: Joaquin Saul Rivera Rivera, Peru
Third place: Viktoria Zhelyazkova Kabaivanova, Bulgaria
Microsoft Excel® (Office 2016)
First place: Songyao Luo, China
Second place: Phat Nguyen Duc, Vietnam
Third place: Ka Kiu Chan, Hong Kong
“In 2020, we missed the opportunity to showcase the incredible talents and accomplishments of these MOS Champions due to the COVID-19 pandemic. However, we couldn’t let the global pandemic stand in the way in 2021,” said Ray Murray, Vice President and General Manager – IT, Pearson VUE.
“It is inspiring to see students from 33 countries come together virtually to ‘speak Microsoft’. The winners receive extra praise, but every single student who entered has earned a valuable workforce credential that will help them find success in college and in their career. The pandemic has highlighted the importance of IT skills for tomorrow’s professionals and it’s incredible to see so many young people get introduced to IT certifications through the MOS World Championship.”
“The Microsoft Office Specialist World Championship is one of my favorite events because these students are thrilled to compete and they inspire all of us with their competitive spirit and crowning achievement,” said Leigh Creswell – Director, Public Sector Skills, Microsoft. “These young people who worked to earn valuable industry-recognized certifications represent a bright future for our industry and a solid foundation for the future skilled global workforce.“
Certiport is the leading provider of performance-based IT certification exams that accelerate academic and career opportunities for learners.
[jetpack_subscription_form subscribe_placeholder=”Enter your email address” show_subscribers_total=”false” button_on_newline=”false” submit_button_text=”Hi, sign up so you can get the latest in breaking news, reviews, opinions, events, opportunities and community updates right in your inbox. ” custom_font_size=”16px” custom_border_radius=”0″ custom_border_weight=”1″ custom_padding=”15″ custom_spacing=”10″ submit_button_classes=”” email_field_classes=”” show_only_email_and_button=”true”]
Check out other stories making the news in the technology ecosystem in Africa and the Middle East.
Are you are about to take a Microsoft Excel interview test or assessment and want to make sure you have all the basics covered? Or do you need a quick refresher course to get you ready to ace your Microsoft Excel test? Here are a few videos below from some amazing teachers that will help you prove your functional knowledge of Excel.
Each video covers something unique or different so kindly check their descriptions to make sure you find what meets your needs. You can also check out excel practice online. A platform that allows you to learn and practice excel functions and tools at any level. All the best with your test and interview.
7 key questions asked as part of the Microsoft Excel interview test with Vadim Mikhailenko
Learn how to to make an entire row bold or italic in excel. Make rows with different background colours and calculate a total for either a quarter or year. Sort out data from smallest to largest and group data based on categories. Other things include inserting a chart into a worksheet and forecasting revenue.
Top frequently asked MS Excel interview questions and answers in any Excel Job Interview test with My E-Lesson
This video covers topics such as Vlookup Formula in Excel, making charts in Excel. Using Pivot Table in Excel, how to remove duplicates in Excel and Protecting Sheets in Excel. It also expounds on tracking, data and simple calculations.
5 Excel interview questions you need to get right with Leila Gharani
Leila is a Microsoft Most Valuable Professional (MVP). She explains Excel VLOOKUP function and limitations, how absolute reference in Excel differ from relative cell reference? Other topics covered are; What is a PivotTable and why should you use it? What is conditional formatting? When would you use the IF Function or a Nested IF in Excel?
[jetpack_subscription_form subscribe_placeholder=”Enter your email address” show_subscribers_total=”false” button_on_newline=”false” submit_button_text=”Hi, sign up so you can get the latest in breaking news, reviews, opinions, events, opportunities and community updates right in your inbox. ” custom_font_size=”16px” custom_border_radius=”0″ custom_border_weight=”1″ custom_padding=”15″ custom_spacing=”10″ submit_button_classes=”” email_field_classes=”” show_only_email_and_button=”true”]
Check out other stories making the news in the technology ecosystem in Africa and the Middle East.
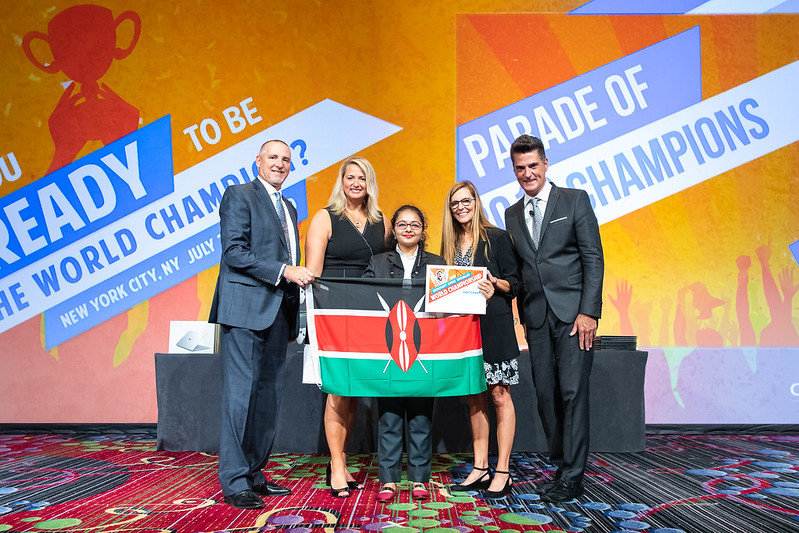
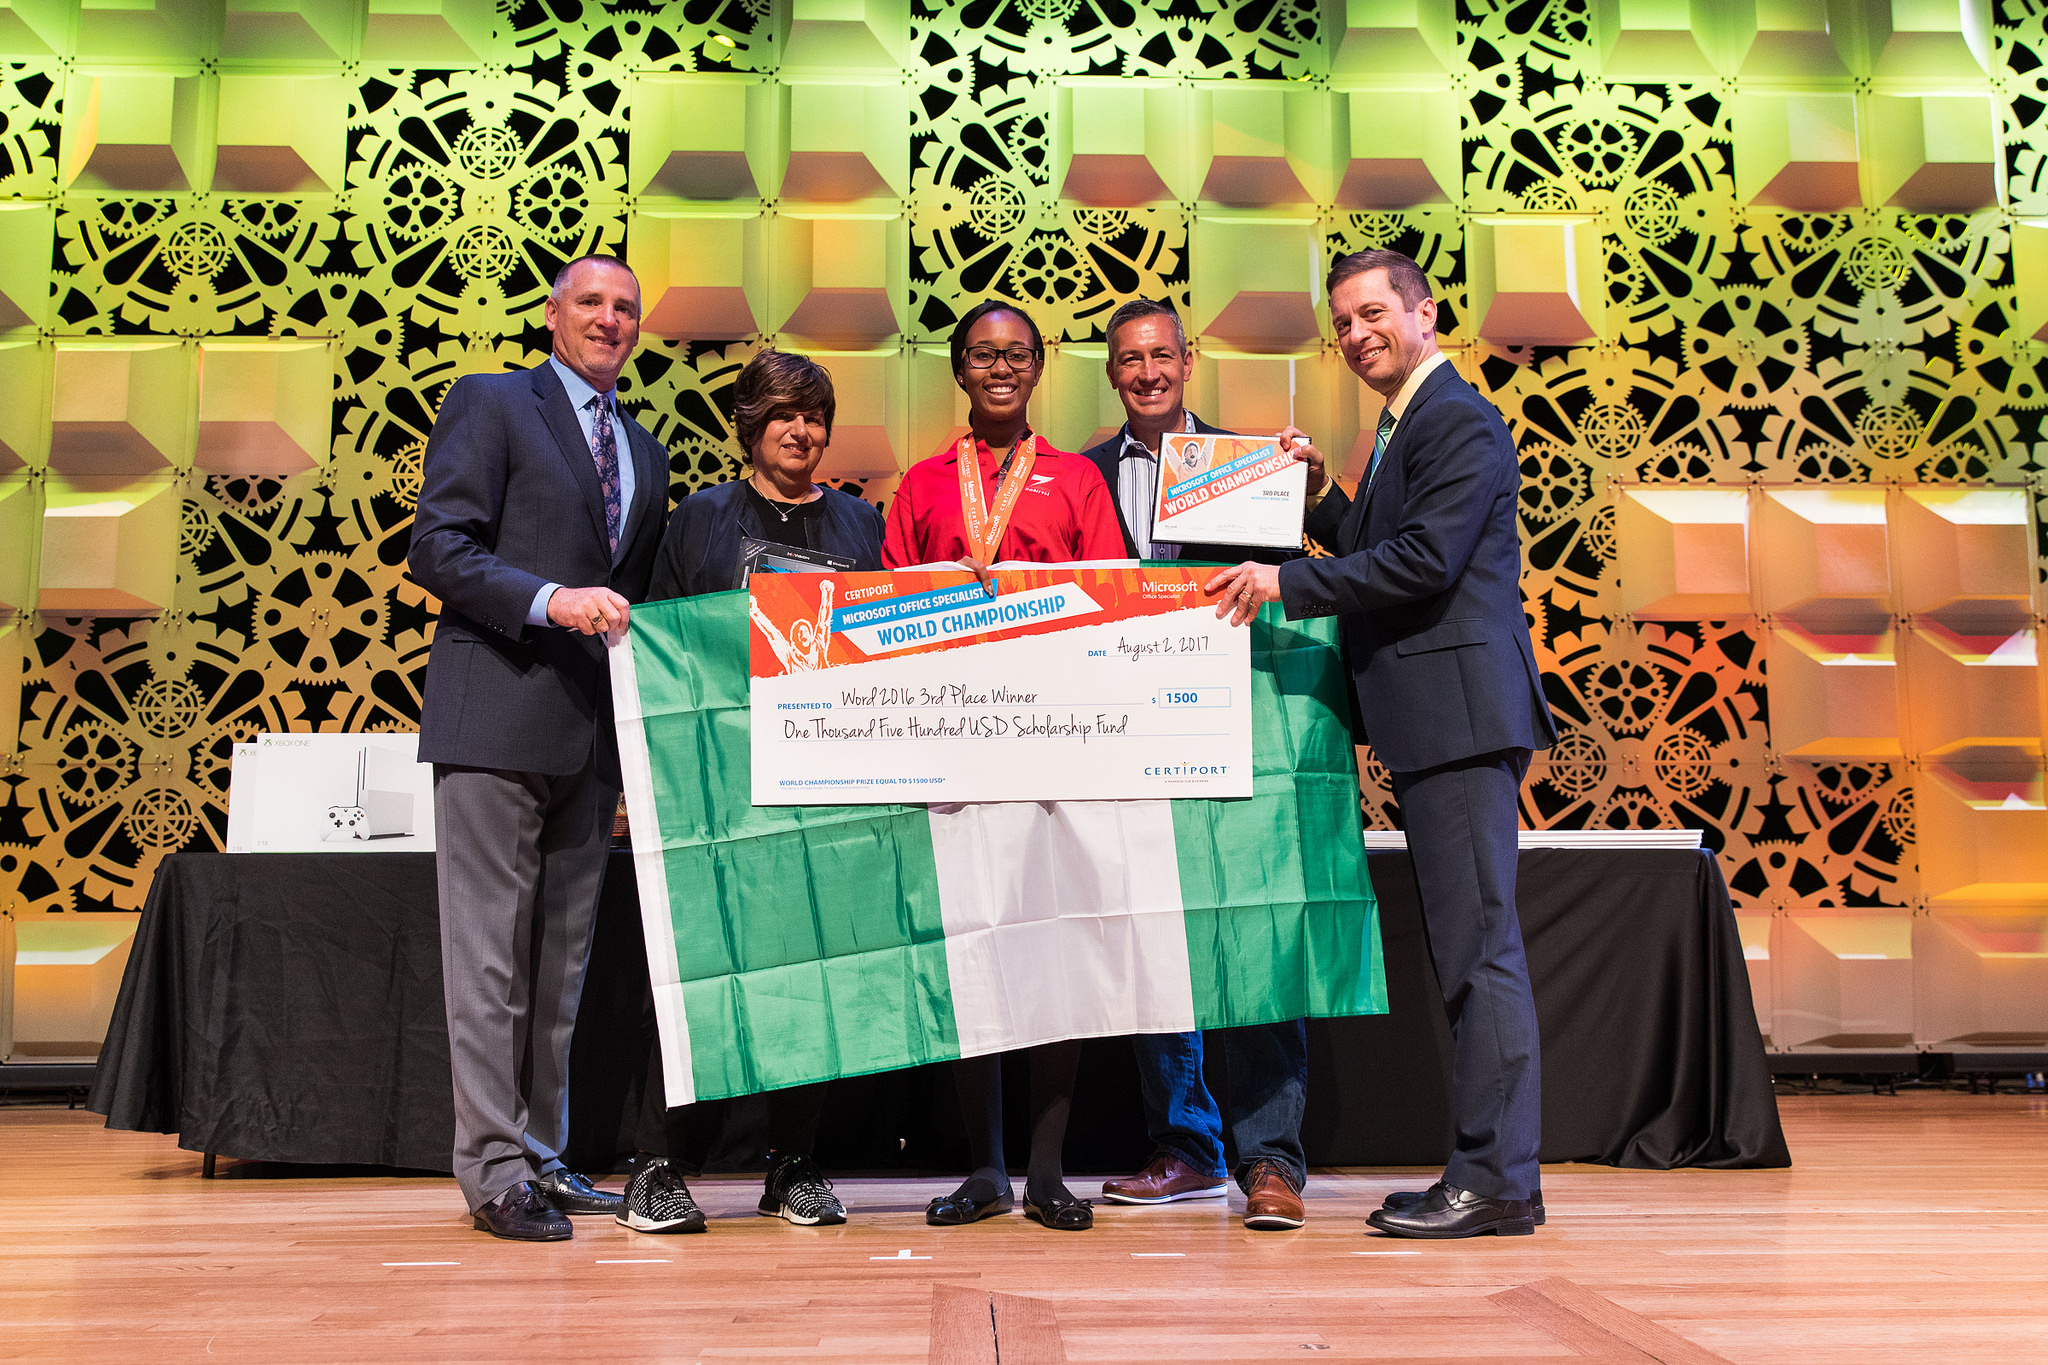
Katherine made Nigeria and Africa proud at the just ended 2017 Microsoft Office Specialist World Championship
With about 560,000 competitors from 122 countries, Katherine competed in the Microsoft Office global competition. The competition tests and awards students skills in Microsoft Word, Excel and PowerPoint.
Is there a competition in Word, Excel and Power point? Apparently yes! and it’s been going on for 16 years. It goes to show there are more ways these programs are used in ordinary day activities. You best maybe use Microsoft Excel for your invoices and Word for your curriculum vitae, uh? lol. There’s more, like using Excel for data computations, analysis and visualizations, etc, etc.
Eta Katherine was 3rd finalist in the Microsoft Word 2016 category. Winning a cash price of $ 1,500, a medal of achievement and a winners certificate. She competed with 156 finalists in the final round of 2017 Microsoft Office Specialist World Championship in Anaheim, USA. In the concluding round, finalist participate in unique project-based tests. Demonstrating their ability to create documents, spreadsheets and presentations for the information presented in Word, Excel, and PowerPoint.
“We are proud to support the MOS World Championship and grateful to meet young people from all parts of the world. Who have discovered the power of Microsoft Office skills for productivity and employability.” – Anneleen Vaandrager – Microsoft Senior Director Education Industry
How to Participate in the Microsoft Office Specialist World Championship ?
The competition is opened to students aged 13 to 22. There are three Microsoft Office categories Word, Excel and Power Point of either 2016 or 2013 tracks.
Students must take a qualifying Microsoft Office Specialist (MOS) certification exam from an accredited learning institution. In other cases, national or regional competitions are held to determine representatives. Selected finalists then compete in the Microsoft Office Specialist World Championship.
Regional participation and availability varies by country. Further details can be obtained by contacting a local Certiport Solution Provider or MOSchampionship@pearson.com .
Winners of the tracks get a cash price of $ 7,000, a medal of achievement, trophy, winners certificate and prizes from Microsoft. Second place finalist get $ 3,500, a medal of achievement and winners certificate.
Here is a list of 2017 wining finalist from all categories and tracks.